Ahead of the start of the playoffs this weekend, stats guru Tom Nielsen returns with a deep dive into player performance from the regular season, adjusting for key factors that impact individual success across Minor League Cricket. Today, Tom looks at batting performance and overall impact from the 2021 regular season.
In our previous post on Bowler Impact Rankings, we introduced a method of measuring bowling performance by accounting for the match situations in which a bowler appeared as well as the grounds they bowled at. In this post, we’ll provide a little more detail behind the ground impact calculations and dive into similar performance metrics for batters and all-rounders.
Ground Impacts
The most important consideration when checking Minor League Cricket stats is knowing where players are playing: about half of all matches are played on artificial wickets, and the other half on more traditional natural turf wickets. Artificial wickets tend to be more batting friendly than turf wickets.
In this analysis, we will use a simple method – essentially the same as what we did for bowling – to determine the impact of each ground on scoring. We can compare actual batting performance at each ground to expected performance based on match situations that occurred at that ground.
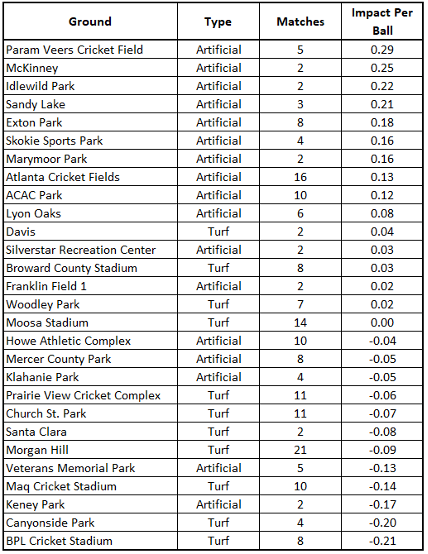
A little bit of math, then, using high-scoring Exton Park (artificial wicket) as an example. The match situations implied a total of 2,046 runs and 95 wickets would be taken in the eight matches played at the ground. In reality, 2,418 runs and 106 wickets were taken. Despite the small increase in wickets vs expectations, actual runs scored were almost 20% higher than expected. Assuming each wicket is worth -4.7 runs, we calculate that actual adjusted runs were 1,920 compared to expectations of 1,597. That’s an increase in runs of 337 runs, spread across 1,824 balls, or 0.184 runs per ball. This value is later plugged into our bowler and batter performance metrics to ensure we’re properly adjusting their performance.
This methodology does risk attributing a team’s extreme batting or bowling strength to the ground they play at often, particularly at grounds with few matches played. Overall though, it is a generally reliable indicator of how a ground plays, and far better than making no adjustments at all. The table below shows the impact of each ground on a ball-by-ball basis. There’s a 0.5 run per ball difference between the top and the bottom, and a clear difference between Artificial (+0.06 runs per ball) and Turf (-0.06 runs per ball) wickets. This 0.12 run per ball amounts to 14 runs over the course of a full innings.
Batting Impacts
Next up, we’ll examine at the best batters in the regular season of Minor League Cricket. Methodology here is again similar to the bowling analysis. Because batters don’t bat for a set number of balls or overs, we’ll simply look at their impact on a match-by-match basis after accounting for match situations and grounds batted at.
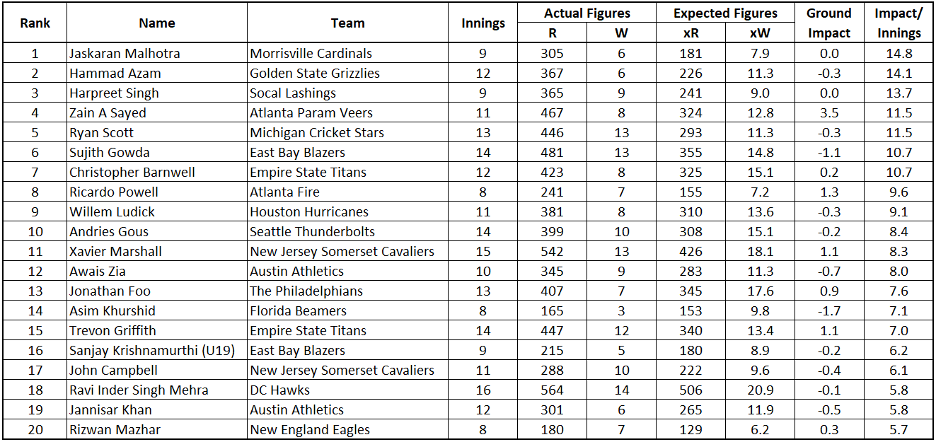
The table below shows the top 20 batters by impact per match (to account for unequal numbers of matches played). We have each batter’s actual runs and outs, along with the expected runs and outs for an average batter given the match situations the batter appeared in.
Leading the way is Jaskaran Malhotra of the Morrisville Cardinals, who (before joining the US National Team’s tour) averaged 51 at an insane strike rate of 188. His season was highlighted by a 90* (35), scoring basically all of Morrisville’s 104 runs in a victory over the Orlando Galaxy at Church Street Park. Joining him at the top is Hammad Azam of the Golden State Grizzlies, matching Malhotra’s 188 strike rate with an average of 61 across his 12 matches. Nearly half of Azam’s 367 runs were scored from his 30 sixes. Both Malhotra and Azam will be found in the playoffs this weekend.
Overall Impact Rankings
Lastly, we can take a look at overall performance, putting together both batting and bowling performance. To combine both batting and bowling, we’ll look at Impact as an aggregate measure, not controlling for number of overs bowled or balls faced.
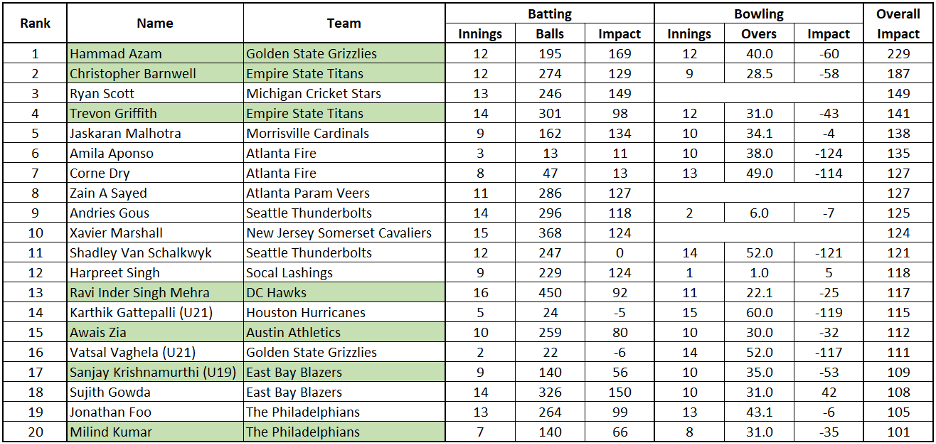
The batting stats outlined in the table below show the number of innings and balls faced for the batter, as well as the season long impact of the batter (i.e., number of runs the batter is adding for his team on top of the average batter’s performance). On the bowling side, it’s innings bowled in, number of overs, and the season long impact of the bowler (i.e., number of runs the bowler is taking off opponent totals compared to the average bowler). Then the overall impact is batting impact – bowling impact. Players who added more than 20 runs of value with the bat and the ball can be considered our genuine all-rounders and are highlighted in green.
At the top of the table is Hammad Azam, who matches his outstanding batting performance with a solid bowling performance, adding 229 runs of value overall to the Golden State Grizzlies compared to the average player. At #2 and #4 are playoff-bound Empire State Titans teammates Christopher Barnwell and Trevon Griffith. These are the top batters for the Titans, each accumulating over 400 runs for the competition at strike rate around 150. They didn’t get as much action with the ball as some of their teammates, but still produced with 12+ wickets each with economy rates under 6.00 runs per over.
In our overall table, we have three youth representatives: Karthik Gattepalli of Houston and Vatsal Vaghela of Golden State, who each dominated with the ball, in addition to US National Team All-Rounder Sanjay Krishnamurthi, who added over 50 runs of value with both bat and ball.
Takeaways
It’s been a fun inaugural regular season in Minor League Cricket! With teams scattered across the country playing on different surfaces and against different opponents, it’s important to contextualize stats when evaluating player performance. Hopefully this has been an informative look at some of the top performers of the regular season. In the next post, we’ll evaluate the eight teams taking part in the playoffs this coming weekend.