MiLC stats guru Tom Nielsen returns with his first player Impact Rankings of the 2022 season at the midway point. Not sure what Impact Rankings are? Read on. . .
Introduction
Cricket, much like its bat-and-ball cousin baseball, is the ultimate game of numbers. You’ve got average, strike rate, economy, wickets, boundary percentage and more: each ball its own data point to be crunched and over-analyzed. It can be challenging to make sense of the dizzying array of numbers, some of which tell contradicting stories. If you read my work last year, you may remember our Impact Stats – we’ll give a little refresher on what the purpose of these figures are and then dive into the top performers of the first half of the 2022 Minor League Cricket season.
Impact Stats Refresher
Here we’ll walk through a brief refresher on the methodology behind Impact Stats. For a more complete overview, see this primer from last season.
In brief, the goal of impact stats is to quantify the impact in runs that each player has on a match relative to the average batter or bowler. Ball-by-ball data enables us to account for the match situations each player appears in: the run and wicket environment can change dramatically over the course of an innings, and this needs to be accounted for to facilitate comparisons between players. Ground impacts are incorporated as some are more batter or bowler friendly than the average ground.
With all of this considered, a player’s batting and bowling impact can be calculated. Batting impact is provided on a per-match basis-i.e., a player contributes +4 runs to his team’s total each match, on average. Bowling impact is provided on a per-over basis-i.e., a player restricts his opponent’s total by an average of -1.5 runs per over.
Minor adjustment from last year’s methodology
To incorporate wickets into a runs-based impact statistic, we first need to quantify the value of a wicket. Last year, I used -4.7 runs as the value of a wicket in Minor League Cricket and applied that across all calculations, so no matter when a player usually appeared within a match, wickets were valued at -4.7 runs. In reality, wicket value varies quite a bit player-to-player based on their role within the team: Wickets will generally be more valuable to opening batters than batters that come in at the death, for example (similarly for bowlers, though bowler usage is a little more consistent). This year, we calculate the average value of a wicket for the match situations in which a player appears and use that as the basis for their impact calculations. The primary benefit is that batters will not get as much credit for saving their wicket late in an innings, because wickets are less valuable than scoring as fast as possible. Similarly, bowlers will get less credit for mopping up low-value wickets near the end of an innings.
Batting Impact Stats
Below is a table showing the top 20 players in Batting Impact per match. Shown is the number of innings for each batter, their strike rate, runs, and wickets compared to expected runs and wickets, and the number of runs they add to their teams’ innings compared to the average batter. The cut-off for appearing on the leaderboard is five matches batted.
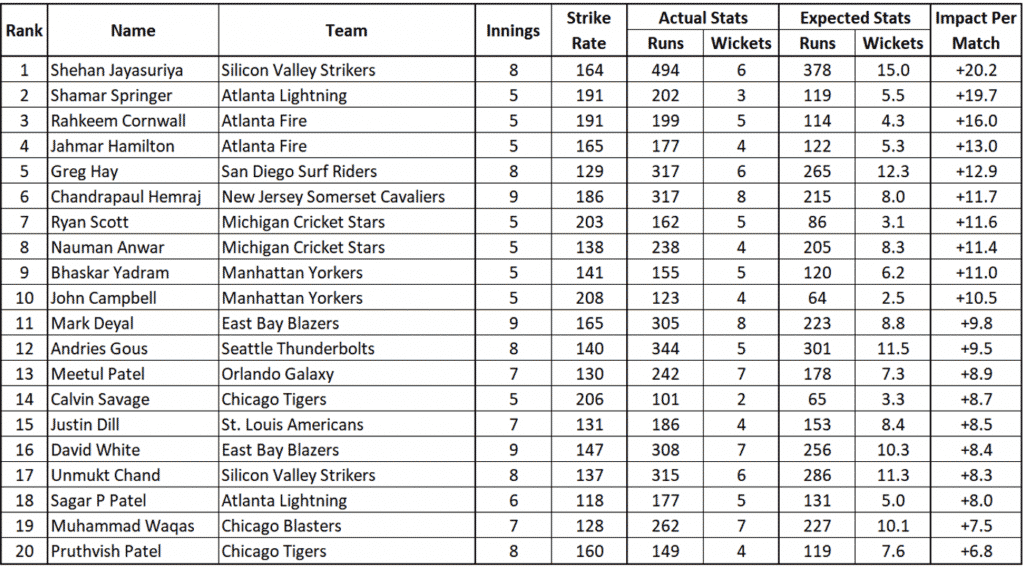
The top run-scorer of Minor League Cricket by a wide margin is Shehan Jayasuriya, and he deservedly tops the impact table, adding a whopping +20.2 runs to Silicon Valley’s batting totals on average. Jayasuriya has 494 runs at an impressive 164 strike rate, scoring 31% faster than batters in similar situations. In addition to quick scoring, he does an outstanding job preserving his wicket, providing great stability to the lineup at the number three position.
Much of the top 10 is filled with some of the most prolific heavy-hitters of Minor League Cricket: Shamar Springer, Rahkeem Cornwall, Chandrapaul Hemraj, Ryan Scott, John Campbell and Calvin Savage, all banging at 185+ strike rates. One exception is Greg Hay at #5, who has 317 runs at a strike rate of “just” 129. Hay loses his wicket at half the rate we would expect from somebody in similar positions: he is an opening batter that’s often batting into the middle and death overs holding San Diego’s innings together.
Bowling Impact Stats
Next, we move onto bowling impact. It’s the same idea as for batting, where we have the number of overs for each bowler with their actual vs expected figures, and finally impact per over bowled. The cut-off for appearing in the bowler leaderboard is 12 overs bowled.
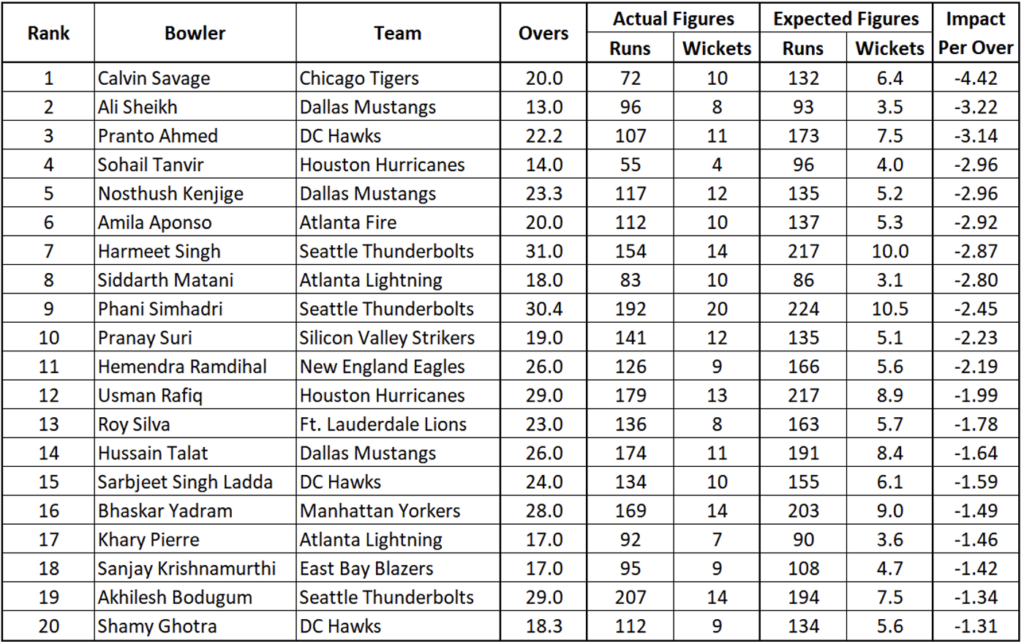
Calvin Savage has been…. (I’m sorry, I have to say it) Savage… with both bat (#14 in impact per match) and ball this year and tops the bowling leaderboard with an incredible -4.42 runs restricted compared to the average bowler per over. Savage has taken a solid 10 wickets from his 20 overs, but what separates him from the pack is his absurd 3.60 economy rate, a full three runs per over better than what would be expected from average bowlers in similar situations.
At number nine on the list is the leading wicket taker in Minor League Cricket, Phani Simhadri. His economy is just a hair closer to average than some of the top players on the list, and he often enters the match in the middle and death overs, when wickets aren’t quite as valuable: this keeps him from the top of the list. The top bowling sides in the league – Dallas, Seattle and DC – all have three representatives on the leaderboard, led by Dallas taking two of the top three spots with youngster Ali Sheikh and US National Teamer Nosthush Kenjige.
Alongside Calvin Savage, all-rounder props go to Bhaskar Yadram of the Manhattan Yorkers. He’s number nine on the batting list with 155 runs at a 141 strike rate and sixteenth on the bowling list with 14 wickets from 20.0 overs.