Ahead of the start of the playoffs this weekend, stats guru Tom Nielsen returns with a deep dive into player performance from the regular season, adjusting for key factors that impact individual success across Minor League Cricket. We start today with a look at bowling performance.
Introducing “Bowler Impact Rankings”
As an American, I cut my sports analytics teeth in the world of baseball’s sabermetrics. A central tenet of baseball analytics is determining the average run value of each potential plate outcome. We can then determine the value added by a player in all their plate appearances and see how many runs above average they are worth over the course of a season. Baseball even goes a step further and accounts for fielding and base-running abilities to determine a player’s Wins Above Replacement.
In cricket, this type of exercise seems easier in theory – a run is a run, although we want to account for the match state (overs and wickets left). But then we’re still left with wickets. Traditional cricket stats simply present runs and wickets side-by-side or in the form of an average. But that still leaves some questions unanswered-would you rather have a bowler averaging 20 at an economy of 6.00 or a bowler averaging 30 at an economy of 4.50? In the limited-overs game, the answer may not be immediately clear. Estimating the run value of a wicket can allow us to represent a bowler’s performance with one number.
Estimating the Run Value of a Wicket
To estimate the run value of a wicket, we take a simple empirical approach: no fancy math or model needed. Based on ball-by-ball data for all Minor League Cricket matches, we can determine the average number of runs remaining in an innings at the beginning of each over, dependent on number of wickets lost.
For example, a team who has lost no wickets at the start of the 3rd over would expect to score another 123.3 runs on average. A team who has lost one wicket at the start of the third over would expect to score another 113.7 runs on average. So if you lose your first wicket in the second over, your expected runs for the match have dropped by -9.6 (as you are expected to score 113.7 more runs rather than 123.3). The value of that wicket for the bowling team was a -9.6-run drop in the opponent’s expected score.
Obviously, wickets taken early or when you’ve already taken a few are more valuable than getting a third wicket in the last few overs. All in all, the average wicket in Minor League Cricket is worth approximately -4.7 runs. Doing similar math for T20I or IPL matches would get you closer to -4 runs, indicating that wickets are slightly more valuable in Minor League Cricket than major T20 leagues.
Adjusting for Match State of Bowler Appearances and Location of Match
Bowler usage strategy has a huge impact on a bowlers’ figures. In the ninth over with a couple of wickets down, the probability of another wicket is something like 3-4%. But if you’re bowling in the last couple of overs, wicket probability shoots up to 9%, along with dramatic increases to run rate. It’s important to account for match state when analyzing a bowler’s figures, to properly give credit to bowlers bowling in more difficult situations (or take credit some away from bowlers that mop up the opponent’s tail).
Similarly, we need to account for the fact that some bowlers play more matches at batter or bowler friendly grounds. This is especially true for Minor League Cricket, where there’s more extreme variation due to the presence of both turf and artificial wickets. Using ball-by-ball data, we can calculate how many runs above or below average each ground plays on each ball. For example, batter friendly Param Veers Cricket Field in Atlanta scores at a whopping 0.29 runs per ball above average. At the opposite end, the turf wicket at BPL Stadium in the Chicago suburbs scores at -0.21 runs per ball below average. This 0.5 run per ball difference implies that the average innings at Param Veers Cricket Field is ~60 runs higher than an average innings at BPL Cricket Stadium. A bowler with a lot of overs at Param Veers Cricket Field needs to be given some credit to account for the fact that their job is harder.
Determining Value of a Bowler
Now we can throw all of this together to determine each bowler’s impact per over. Essentially, we start with the runs conceded by a bowler and subtract the number of wickets multiplied by the average run value of a wicket. This gives us “adjusted runs conceded”, which can be used to calculate an adjusted economy rate (adjusted runs conceded divided by overs bowled). We can then compare to their expected adjusted economy rate based on the match state and location of their overs bowled. This will finally give us a nice clean metric-runs allowed per over relative to the average bowler. Let’s get to the math, using young Golden State Grizzlies phenom Vatsal Vaghela as an example:
Vatsal Vaghela allowed 287 runs and took 25 wickets over 52 overs. The average bowler in this situation would allow 370 runs and take 16 wickets (i.e., figures much weaker than what Vaghela allowed). His adjusted runs allowed are 287 – 4.7*25 = 169, making for an adjusted economy of 169/52 = 3.26. The average bowler in these situations would have an adjusted economy of 370 – 4.7*16 = 295/52 = 5.68. Vaghela bowled at slightly bowler friendly grounds, helping him to the tune of 0.17 runs per over. Putting this all together, we can calculate that relative to an average bowler, Vatsal Vaghela restricted his opponents’ total by an average of 3.26 – 5.68 + 0.17 = -2.25 runs per over.
This final number is called Bowler Impact. Now, we can look at the leaderboard for Bowler Impact over the course of the Minor League Cricket regular season!
Bowler Impact Rankings
Here, we’re looking at impact on a per-over basis to account for varying numbers of matches across teams and the fact that some players have come in late or left early for US National Team duty. In the table below we have overs bowled, actual and expected bowling figures, the impact of the grounds they bowled at per over, and the overall impact. The “Ground” impact can be interpreted as the number of runs per over above or below average are scored in the grounds that bowler bowled at. So Amila Aponso at #1 bowled at grounds that scored +0.50 runs per over above average, making his figures even more impressive than they appear at first glance.
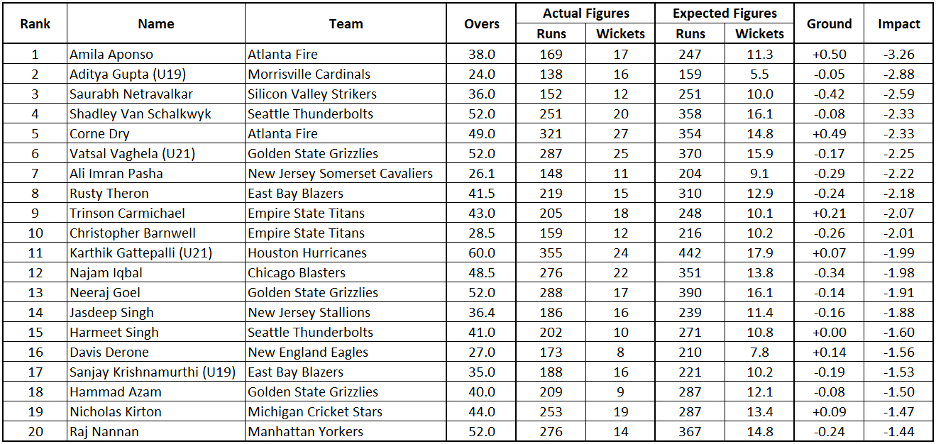
At the top of the rankings is Amila Aponso of the Atlanta Fire with an Impact of -3.26 runs per over, nearly 0.40 runs per over ahead of second place Aditya Gupta of the Morrisville Cardinals. Joining Aponso in the top five is his Atlanta Fire teammate Corne Dry at -2.33; it comes as no surprise that the Fire claimed the Southern Division title in the Atlantic Conference! All in all, 11 of the Top 20 bowlers will be representing playoff teams this weekend.
Youth (players filling a U21 or U19 slot) is well represented in the top 20, with Aditya Gupta at #2, Vatsal Vaghela at #6, Karthik Gattepalli of the Houston Hurricanes at #11, and Sanjay Krishnamurthi of the East Bay Blazers at #17. We also see a few US National teamers – Krishnamurthi, Saurabh Netravalkar at #3, Rusty Theron at #8, and Jessy Singh at #14.
Takeaways
This analysis allows us to measure bowlers’ effectiveness while controlling for the match situations in which they appear as well as the grounds the bowlers play at. We are able to give credit for bowlers who bowl in difficult match situations and at grounds that are well-suited for batting. In future analysis, we will do the same thing for batters and judge the best overall players in the league by these metrics.